

Modular flooring manufacturer Interface (NASDAQ:TILE) reported Q2 CY2025 results exceeding the market’s revenue expectations, with sales up 8.3% year on year to $375.5 million. The company expects next quarter’s revenue to be around $355 million, close to analysts’ estimates. Its non-GAAP profit of $0.60 per share was 27.7% above analysts’ consensus estimates.
Is now the time to buy Interface? Find out by accessing our full research report, it’s free.
Interface (TILE) Q2 CY2025 Highlights:
- Revenue: $375.5 million vs analyst estimates of $359.1 million (8.3% year-on-year growth, 4.6% beat)
- Adjusted EPS: $0.60 vs analyst estimates of $0.47 (27.7% beat)
- Adjusted EBITDA: $64.8 million vs analyst estimates of $55.47 million (17.3% margin, 16.8% beat)
- The company lifted its revenue guidance for the full year to $1.38 billion at the midpoint from $1.35 billion, a 2% increase
- Operating Margin: 13.9%, up from 11% in the same quarter last year
- Free Cash Flow Margin: 6.1%, up from 3.5% in the same quarter last year
- Market Capitalization: $1.21 billion
“We delivered strong second quarter results ahead of our expectations with currency-neutral net sales growth of 7% and significantly expanded profitability. We continued to see strong momentum and market share gains in the Americas with currency-neutral net sales growth of 11% driven by our combined selling teams and expanded product offerings,” commented Laurel Hurd, CEO of Interface.
Company Overview
Pioneering carbon-neutral flooring since its founding in 1973, Interface (NASDAQ:TILE) is a global manufacturer of modular carpet tiles, luxury vinyl tile (LVT), and rubber flooring that specializes in carbon-neutral and sustainable flooring solutions.
Revenue Growth
A company’s long-term sales performance is one signal of its overall quality. Any business can experience short-term success, but top-performing ones enjoy sustained growth for years.
With $1.35 billion in revenue over the past 12 months, Interface is a small player in the business services space, which sometimes brings disadvantages compared to larger competitors benefiting from economies of scale and numerous distribution channels.
As you can see below, Interface grew its sales at a sluggish 1.8% compounded annual growth rate over the last five years. This shows it failed to generate demand in any major way and is a rough starting point for our analysis.
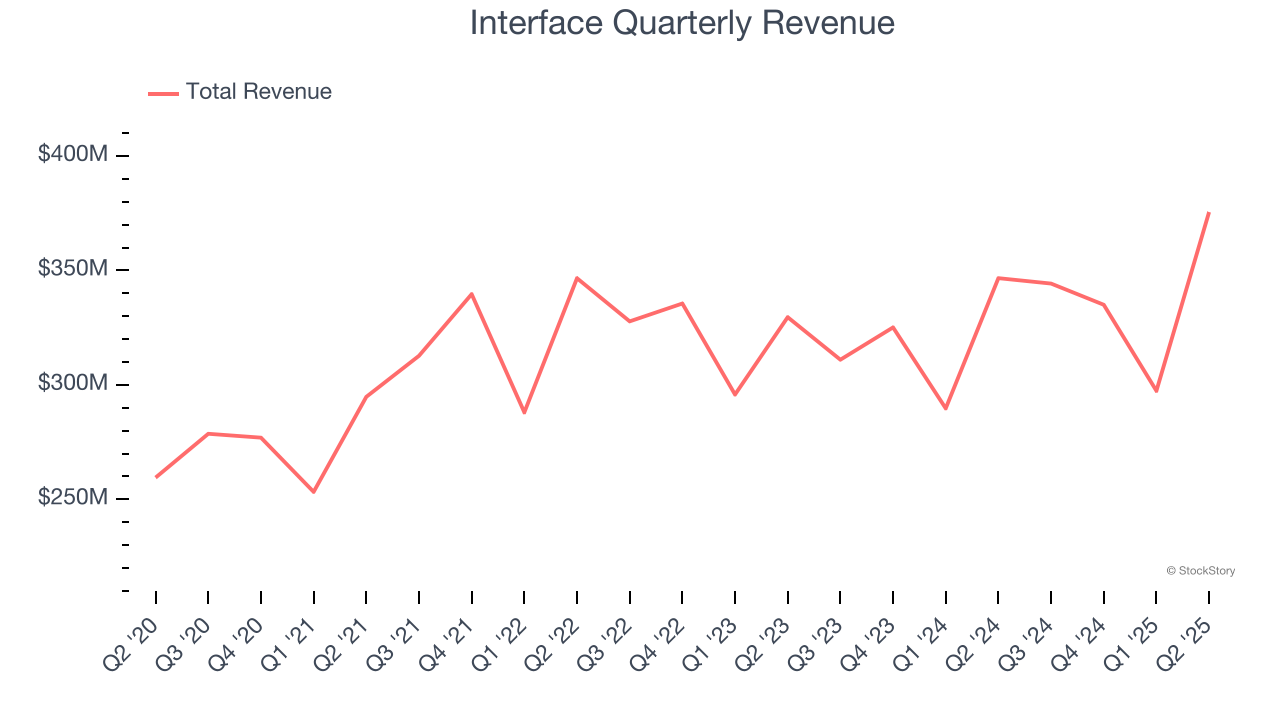
Long-term growth is the most important, but within business services, a half-decade historical view may miss new innovations or demand cycles. Interface’s annualized revenue growth of 2.4% over the last two years aligns with its five-year trend, suggesting its demand was consistently weak. 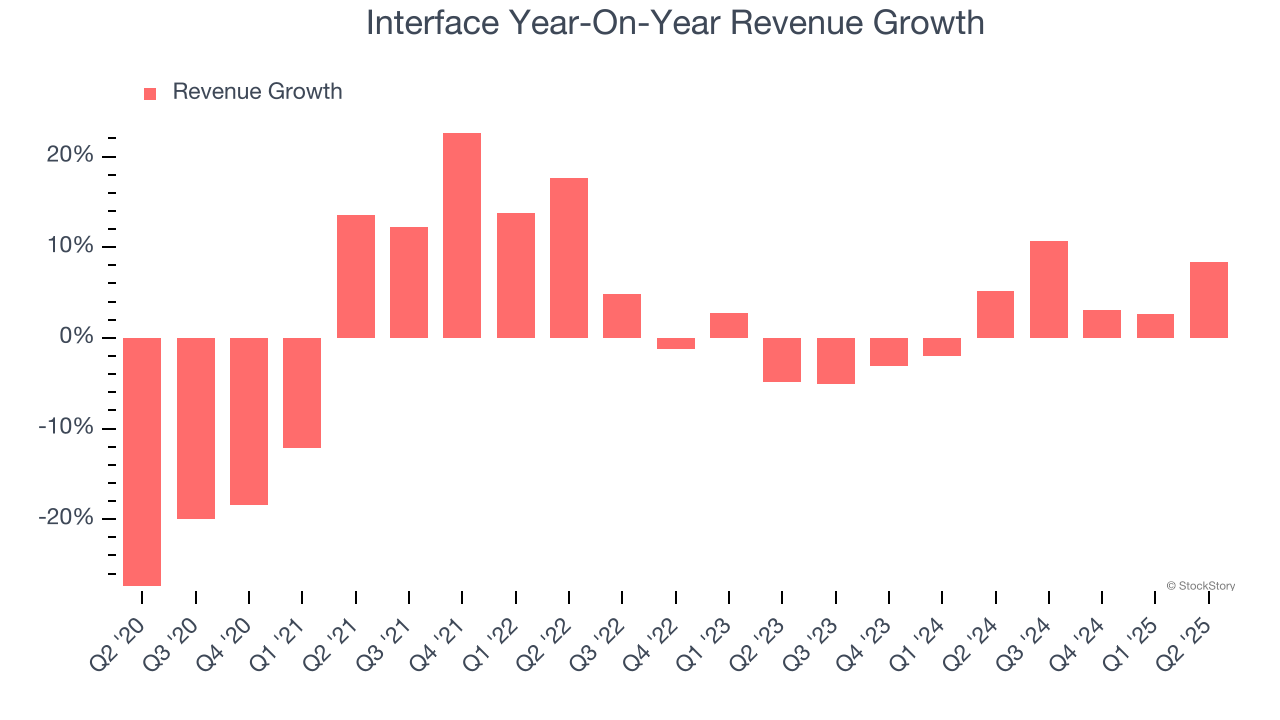
This quarter, Interface reported year-on-year revenue growth of 8.3%, and its $375.5 million of revenue exceeded Wall Street’s estimates by 4.6%. Company management is currently guiding for a 3.1% year-on-year increase in sales next quarter.
Looking further ahead, sell-side analysts expect revenue to grow 2.6% over the next 12 months, similar to its two-year rate. This projection is underwhelming and suggests its newer products and services will not catalyze better top-line performance yet.
Here at StockStory, we certainly understand the potential of thematic investing. Diverse winners from Microsoft (MSFT) to Alphabet (GOOG), Coca-Cola (KO) to Monster Beverage (MNST) could all have been identified as promising growth stories with a megatrend driving the growth. So, in that spirit, we’ve identified a relatively under-the-radar profitable growth stock benefiting from the rise of AI, available to you FREE via this link.
Operating Margin
Interface was profitable over the last five years but held back by its large cost base. Its average operating margin of 8.4% was weak for a business services business.
On the plus side, Interface’s operating margin rose by 3.4 percentage points over the last five years, as its sales growth gave it operating leverage.
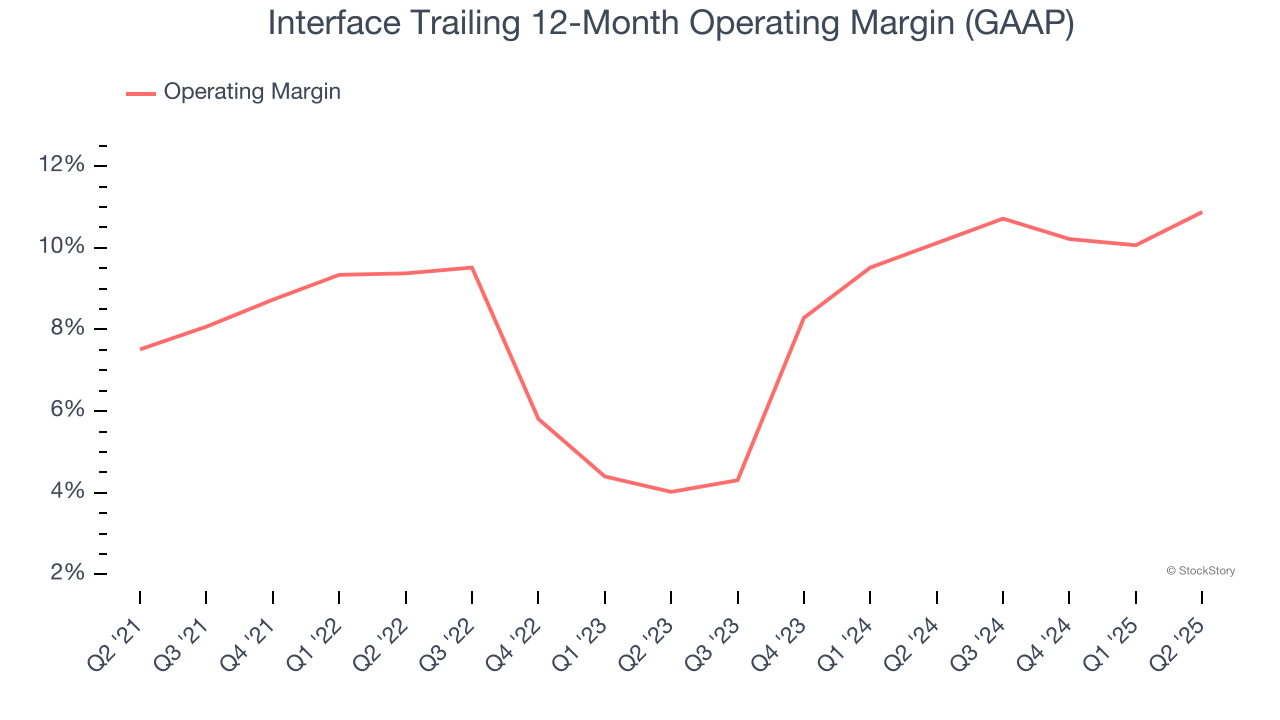
In Q2, Interface generated an operating margin profit margin of 13.9%, up 2.9 percentage points year on year. This increase was a welcome development and shows it was more efficient.
Earnings Per Share
Revenue trends explain a company’s historical growth, but the long-term change in earnings per share (EPS) points to the profitability of that growth – for example, a company could inflate its sales through excessive spending on advertising and promotions.
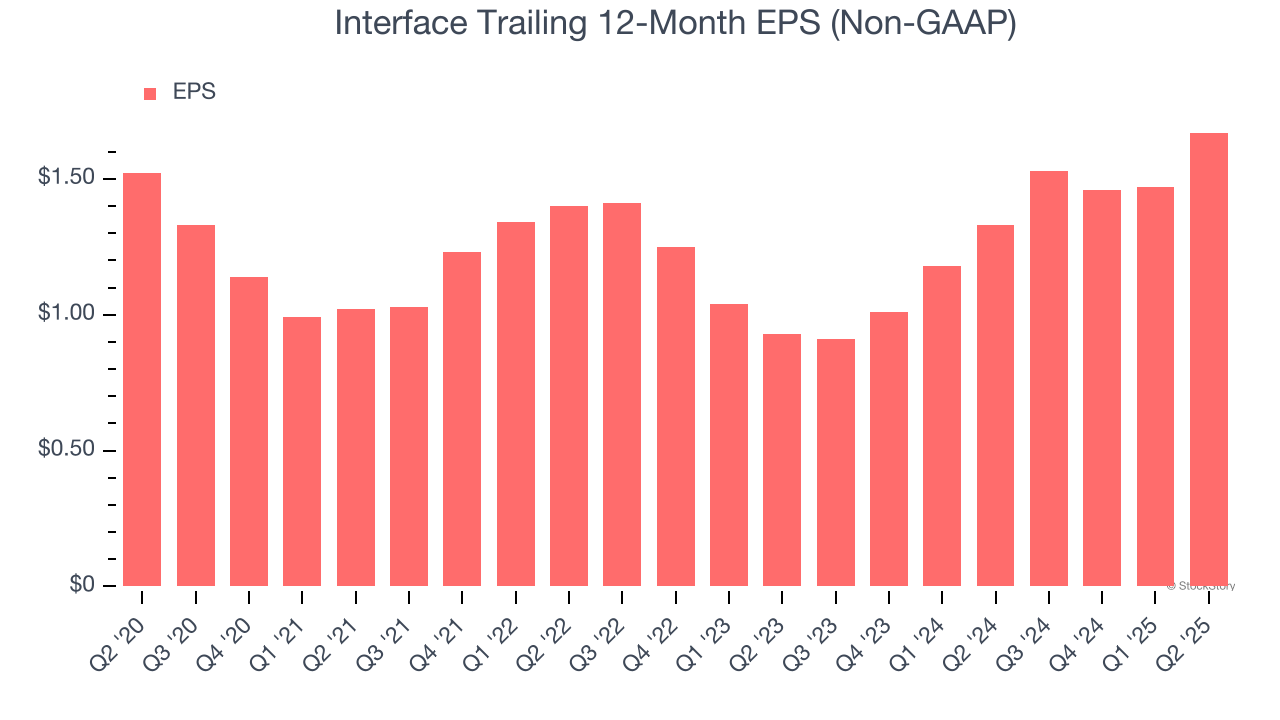
Interface’s weak 1.9% annual EPS growth over the last five years aligns with its revenue performance. On the bright side, this tells us its incremental sales were profitable.
Like with revenue, we analyze EPS over a shorter period to see if we are missing a change in the business.
Interface’s two-year annual EPS growth of 34% was fantastic and topped its 2.4% two-year revenue growth.
Diving into the nuances of Interface’s earnings can give us a better understanding of its performance. Interface’s operating margin has expanded by 5.1 percentage points over the last two years. This was the most relevant factor (aside from the revenue impact) behind its higher earnings; interest expenses and taxes can also affect EPS but don’t tell us as much about a company’s fundamentals.
In Q2, Interface reported adjusted EPS at $0.60, up from $0.40 in the same quarter last year. This print easily cleared analysts’ estimates, and shareholders should be content with the results. We also like to analyze expected EPS growth based on Wall Street analysts’ consensus projections, but there is insufficient data.
Key Takeaways from Interface’s Q2 Results
We were impressed by how significantly Interface blew past analysts’ EPS expectations this quarter. We were also glad its revenue outperformed Wall Street’s estimates. Zooming out, we think this was a solid print. The stock traded up 6.6% to $22 immediately following the results.
Interface put up rock-solid earnings, but one quarter doesn’t necessarily make the stock a buy. Let’s see if this is a good investment. What happened in the latest quarter matters, but not as much as longer-term business quality and valuation, when deciding whether to invest in this stock. We cover that in our actionable full research report which you can read here, it’s free.