

Aerospace and defense company Cadre (NYSE:CDRE) reported Q2 CY2025 results exceeding the market’s revenue expectations, with sales up 8.9% year on year to $157.1 million. On the other hand, the company’s full-year revenue guidance of $627 million at the midpoint came in 0.5% below analysts’ estimates. Its GAAP profit of $0.30 per share was 13.5% above analysts’ consensus estimates.
Is now the time to buy Cadre? Find out by accessing our full research report, it’s free.
Cadre (CDRE) Q2 CY2025 Highlights:
- Revenue: $157.1 million vs analyst estimates of $152 million (8.9% year-on-year growth, 3.3% beat)
- EPS (GAAP): $0.30 vs analyst estimates of $0.26 (13.5% beat)
- Adjusted EBITDA: $26.99 million vs analyst estimates of $27.22 million (17.2% margin, 0.8% miss)
- The company dropped its revenue guidance for the full year to $627 million at the midpoint from $633 million, a 0.9% decrease
- EBITDA guidance for the full year is $114 million at the midpoint, below analyst estimates of $117.1 million
- Operating Margin: 9.3%, down from 13.8% in the same quarter last year
- Free Cash Flow Margin: 0.7%, down from 6.3% in the same quarter last year
- Market Capitalization: $1.34 billion
“We delivered strong revenue growth and profitability in the second quarter, despite a fluid macro environment, which underscores the positive demand trends we continue to see for Cadre’s best-in-class safety products across our law enforcement, first responder, military and nuclear categories,” said Warren Kanders, CEO and Chairman.
Company Overview
Originally known as Safariland, Cadre (NYSE:CDRE) specializes in manufacturing and distributing safety and survivability equipment for first responders.
Revenue Growth
Examining a company’s long-term performance can provide clues about its quality. Any business can have short-term success, but a top-tier one grows for years. Over the last five years, Cadre grew its sales at a decent 8.5% compounded annual growth rate. Its growth was slightly above the average industrials company and shows its offerings resonate with customers.
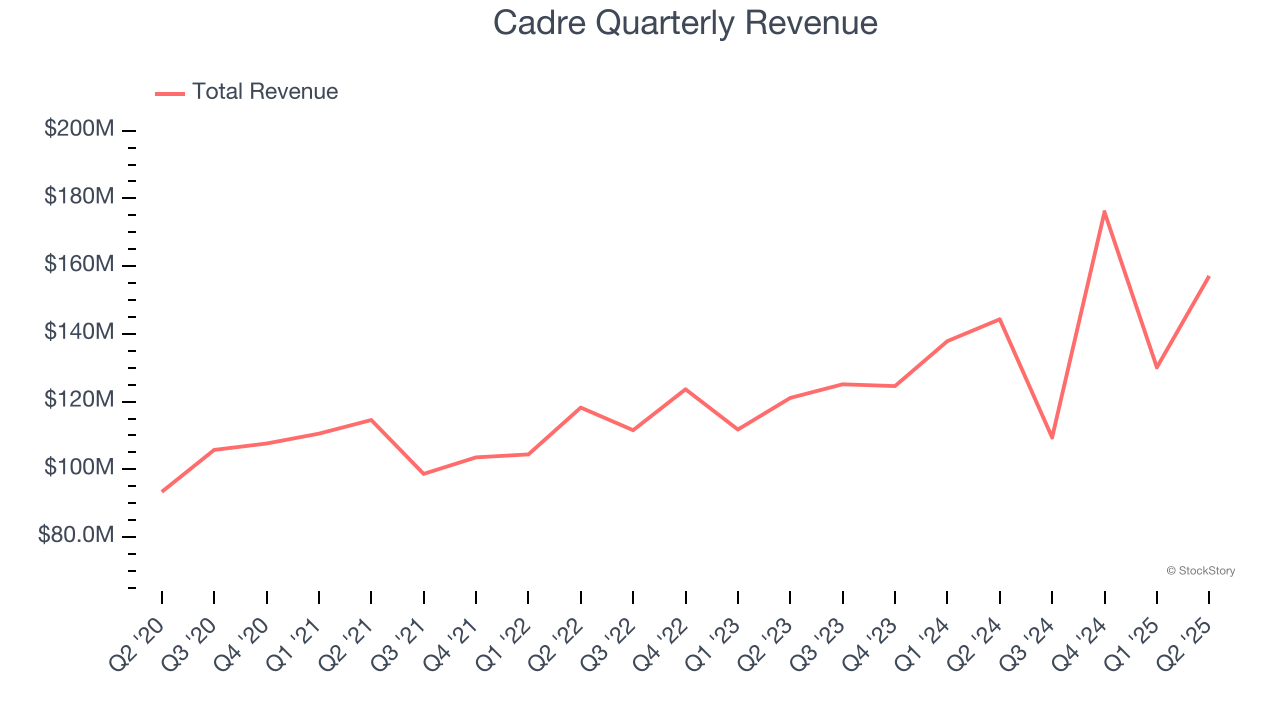
Long-term growth is the most important, but within industrials, a half-decade historical view may miss new industry trends or demand cycles. Cadre’s annualized revenue growth of 10.6% over the last two years is above its five-year trend, suggesting its demand recently accelerated. 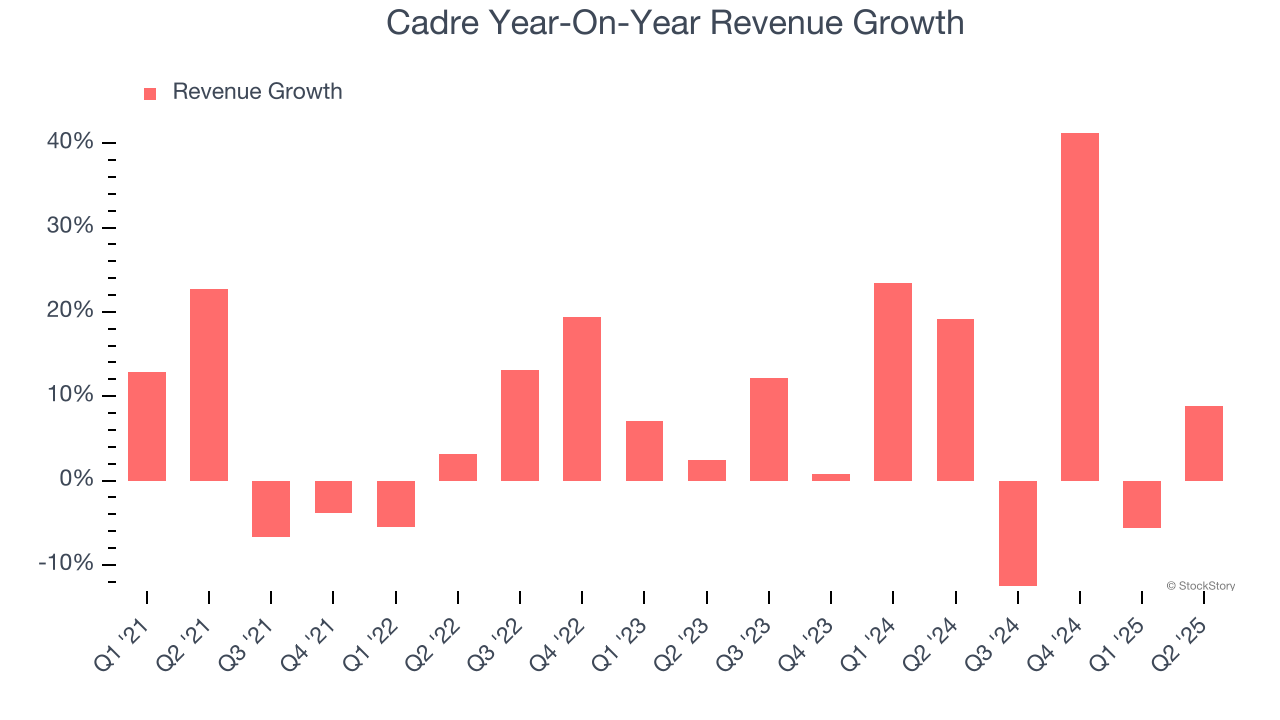
We can dig further into the company’s revenue dynamics by analyzing its most important segment, Products. Over the last two years, Cadre’s Products revenue (body armor, corrections tools, sensors) averaged 13.2% year-on-year growth. This segment has outperformed its total sales during the same period, lifting the company’s performance. 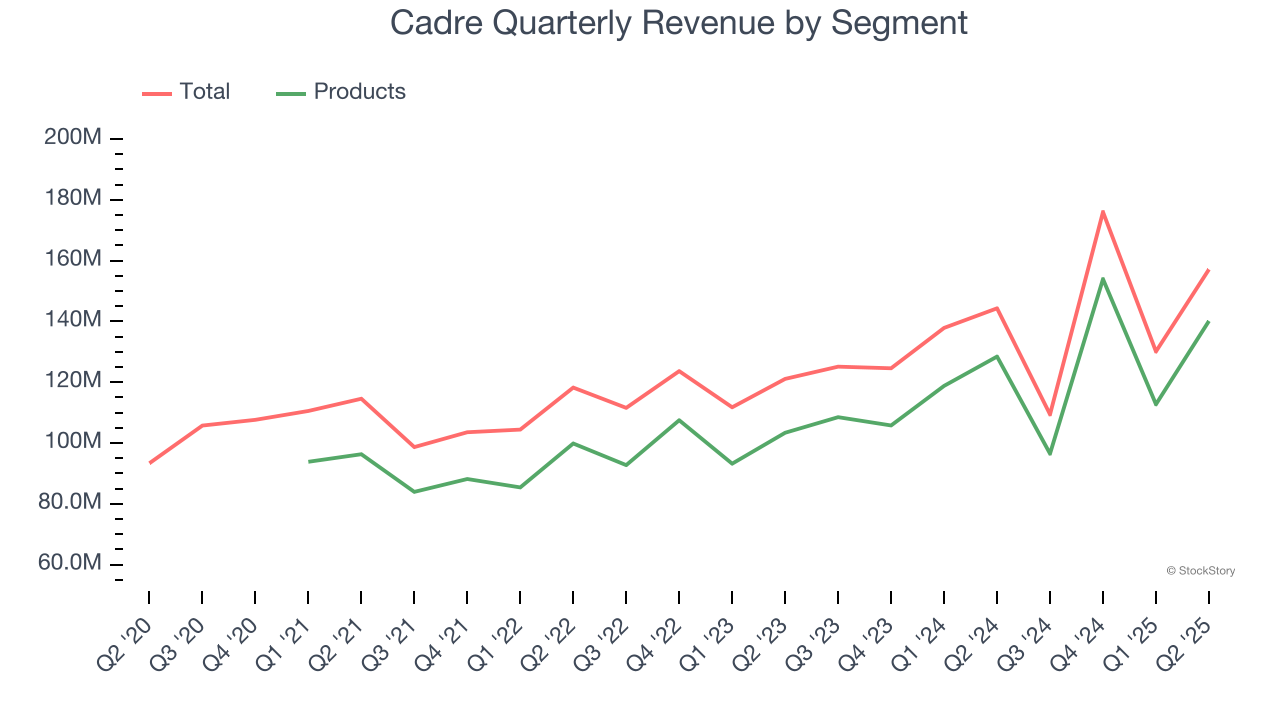
This quarter, Cadre reported year-on-year revenue growth of 8.9%, and its $157.1 million of revenue exceeded Wall Street’s estimates by 3.3%.
Looking ahead, sell-side analysts expect revenue to grow 17.1% over the next 12 months, an improvement versus the last two years. This projection is eye-popping and implies its newer products and services will catalyze better top-line performance.
Here at StockStory, we certainly understand the potential of thematic investing. Diverse winners from Microsoft (MSFT) to Alphabet (GOOG), Coca-Cola (KO) to Monster Beverage (MNST) could all have been identified as promising growth stories with a megatrend driving the growth. So, in that spirit, we’ve identified a relatively under-the-radar profitable growth stock benefiting from the rise of AI, available to you FREE via this link.
Operating Margin
Cadre has managed its cost base well over the last five years. It demonstrated solid profitability for an industrials business, producing an average operating margin of 10%.
Looking at the trend in its profitability, Cadre’s operating margin decreased by 1.7 percentage points over the last five years. This raises questions about the company’s expense base because its revenue growth should have given it leverage on its fixed costs, resulting in better economies of scale and profitability.
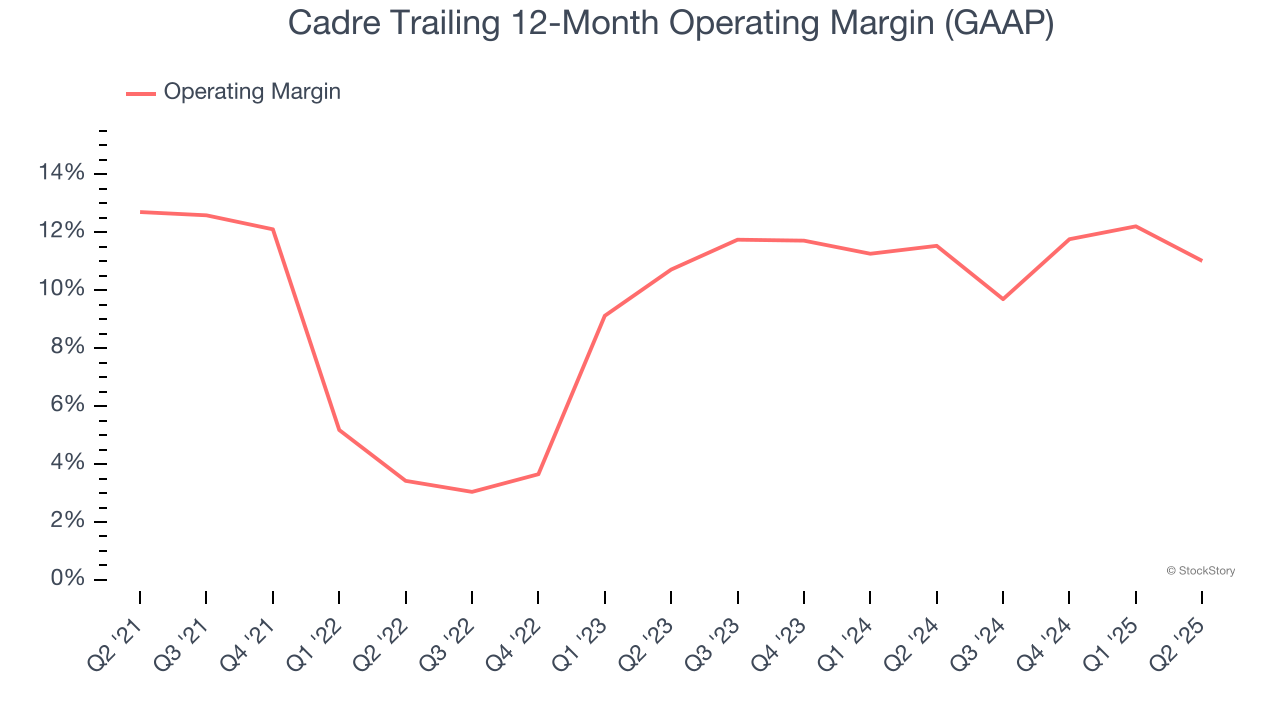
In Q2, Cadre generated an operating margin profit margin of 9.3%, down 4.5 percentage points year on year. This contraction shows it was less efficient because its expenses grew faster than its revenue.
Earnings Per Share
Revenue trends explain a company’s historical growth, but the long-term change in earnings per share (EPS) points to the profitability of that growth – for example, a company could inflate its sales through excessive spending on advertising and promotions.
Sadly for Cadre, its EPS declined by 2.1% annually over the last five years while its revenue grew by 8.5%. This tells us the company became less profitable on a per-share basis as it expanded.
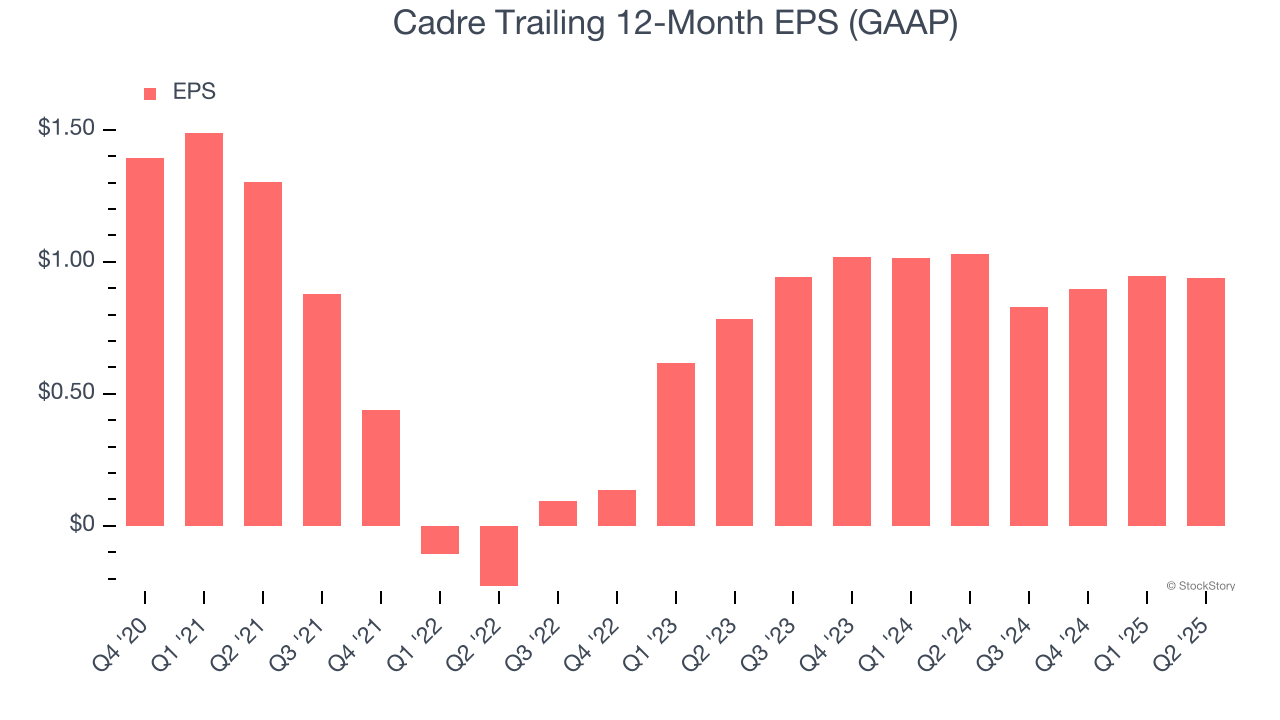
We can take a deeper look into Cadre’s earnings to better understand the drivers of its performance. As we mentioned earlier, Cadre’s operating margin declined by 1.7 percentage points over the last five years. This was the most relevant factor (aside from the revenue impact) behind its lower earnings; interest expenses and taxes can also affect EPS but don’t tell us as much about a company’s fundamentals.
Like with revenue, we analyze EPS over a shorter period to see if we are missing a change in the business.
For Cadre, its two-year annual EPS growth of 9.7% was higher than its five-year trend. Accelerating earnings growth is almost always an encouraging data point.
In Q2, Cadre reported EPS at $0.30, in line with the same quarter last year. This print easily cleared analysts’ estimates, and shareholders should be content with the results. Over the next 12 months, Wall Street expects Cadre’s full-year EPS of $0.94 to grow 46.6%.
Key Takeaways from Cadre’s Q2 Results
We were impressed by how significantly Cadre blew past analysts’ Products revenue expectations this quarter. We were also glad its revenue outperformed Wall Street’s estimates. On the other hand, its full-year revenue guidance was dropped, which is usually a bad sign. Full-year EBITDA guidance also missed Wall Street’s estimates. Zooming out, we think this was a mixed quarter, with guidance weighing on shares. Th stock traded down 8.8% to $31.59 immediately after reporting.
Should you buy the stock or not? When making that decision, it’s important to consider its valuation, business qualities, as well as what has happened in the latest quarter. We cover that in our actionable full research report which you can read here, it’s free.